Education
46 views
Ignoring failures can lead you into a pitfall. Well, this adage holds true not only in real life but also in the world of trading. Survivorship bias is a common issue in market data analysis. It occurs when you focus only on surviving entities, ignoring those that failed. Such an analysis often leads to skewed conclusions. Hence, identifying and mitigating survivorship bias is important for accurate market analysis and better trading decisions.
In this article, we will explore the concept of survivorship bias, identify its red flags, and provide practical strategies to avoid it. You will learn how survivorship bias can lead to overestimated performance and underestimated risks, which often mislead traders.
We will also share some real-world examples and case studies where survivorship bias significantly impacted market analysis and trading decisions. Moreover, we will cover techniques for adjusting backtesting methods and incorporating comprehensive datasets that include both surviving and non-surviving entities. By applying statistical techniques, such as bootstrapping and Monte Carlo simulations, you will master how to create more robust and realistic trading strategies. Let’s begin.
What is Survivorship Bias?
Survivorship bias is a logical error. It occurs when one focuses only on entities that have passed a selection process while overlooking those that did not. Such an error often leads to skewed conclusions because the sample being analyzed is not representative of the entire population.
Now, in the context of market data, survivorship bias happens when analysts or investors only consider stocks or financial instruments that have survived over a certain period. While considering this, they ignore those stocks that have failed. Such ignorance leads to an:
- Overestimation of historical returns
and
- Unrealistic assessment of risk.
To understand better let’s study a hypothetical example showing survivorship bias in a stock index:
The concept
Say a stock index tracks the performance of a selection of companies. Over time, some companies get delisted due to bankruptcy, mergers, or other reasons. Now, assume that if the index calculation excludes these delisted companies and only includes the companies that remain listed, the index will show a higher historical return than what was actually experienced by investors who held the entire portfolio of original stocks.
Putting in numbers
- Say an index started with 100 companies 20 years ago.
- Over the years, 30 of these companies went bankrupt and were removed from the index, while the remaining 70 companies performed well.
- If we only look at the performance of the surviving 70 companies, the historical return of the index will appear much higher than if we included the losses from the 30 companies that went bankrupt.
- This creates a distorted picture of past performance.
- In this case, the index will seem more successful than it truly was.
What is OODA Loop and Psychological Operations in Trading?
The OODA (Observe, Orient, Decide, Act) loop is a decision-making process, which was designed by military strategist and US Air Force Colonel, John Boyd. The OODA loop has been adapted for usage in diverse domains, including trading. In trading, the OODA loop can help traders make better decisions by:
- Observing: Gathering information about market conditions, price movements, and other relevant factors.
- Orienting: Analyzing the information to understand the current market environment and how it relates to their trading strategy.
- Deciding: Determining whether to enter, exit, or adjust a trade based on the analysis.
- Acting: Executing the trade decision.
When it comes to Psy Ops (Psychological Operations) in trading, they refer to strategies used to influence the perception and behavior of other market participants. This commonly includes:
- Spreading rumors,
- Creating false market signals, or
- Using other tactics intended to manipulate market sentiment and gain an advantage.
By utilizing the OODA loop and being aware of potential psy ops, traders can make more informed and rational decisions. Such an understanding can significantly improve their chances of success in the markets.
Implications of Survivorship Bias for Traders
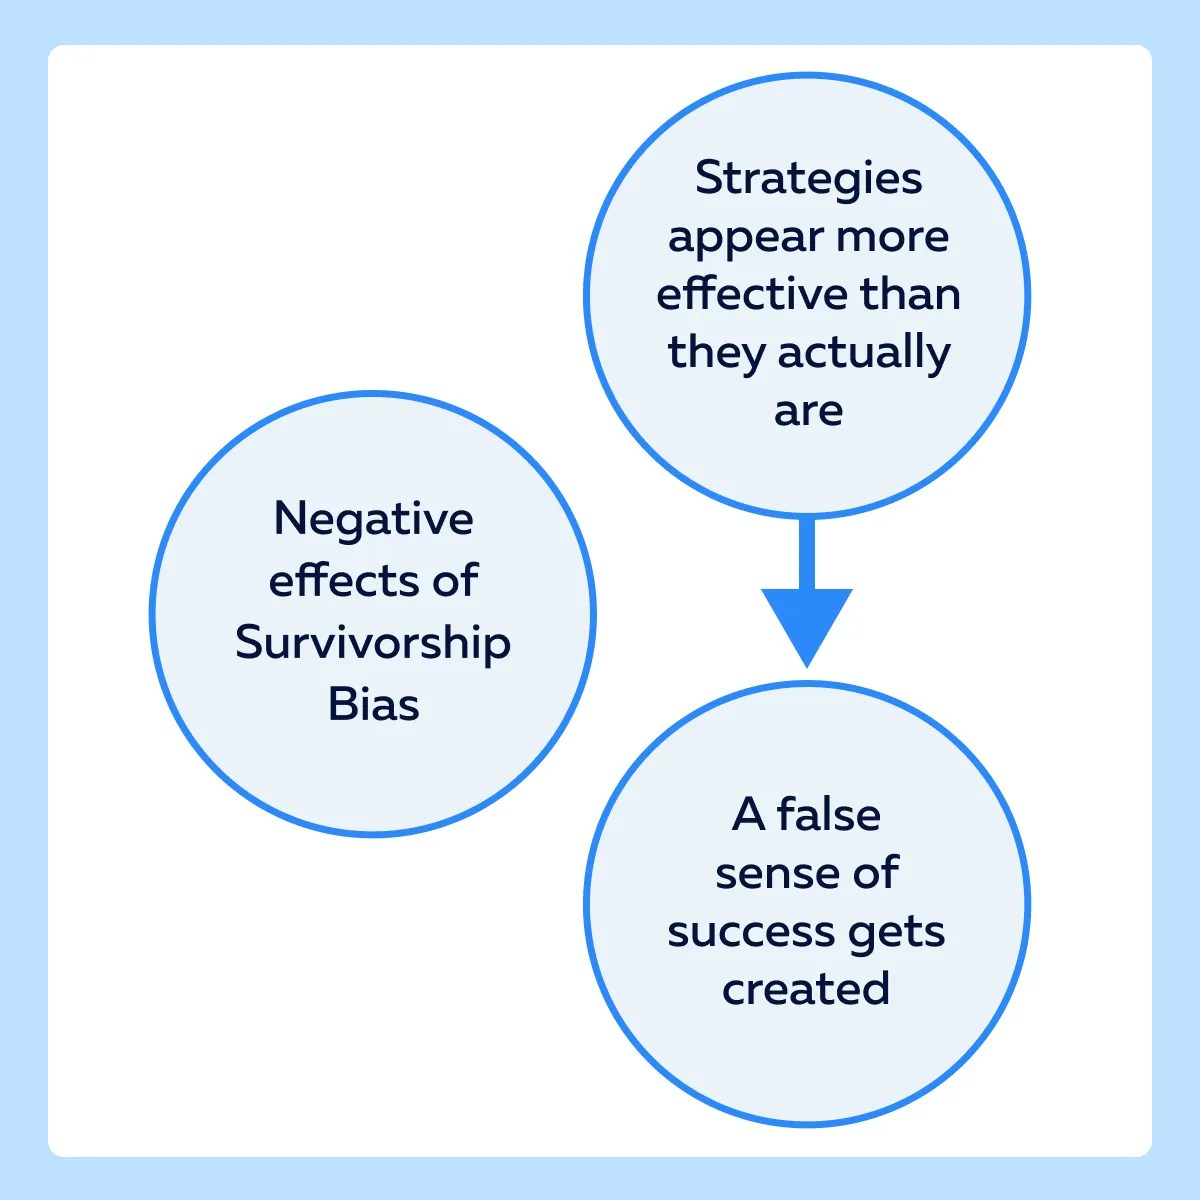
Survivorship bias significantly impacts traders by leading to overestimated performance metrics. When traders analyze historical data, they often focus on the companies or assets that have survived over a period. They inadvertently ignore those who have failed or underperformed.
See the graphic below to check out the ill effects of such a selective analysis:

Let’s understand better through an example:
- Say a trader backtests a trading strategy using data from a stock index that has removed delisted companies.
- The strategy shows a 15% annual return over the past decade.
- However, if the trader included the companies that were delisted due to poor performance or bankruptcy, the actual return might drop to 8%.
- The inflated performance metric misleads the trader into believing the strategy is highly profitable.
- This leads to poor investment decisions when applied in real-time markets.
What happens when you underestimate risk and volatility?
Ignoring failed entities often leads to underestimating both the risk and the volatility of a trading strategy or portfolio. The exclusion of underperforming or failed assets skews the perception of stability and reduces the apparent risk.
For Example: Consider two portfolios over a 10-year period:
- Portfolio A:
- Includes only stocks that survived the entire period.
- The annual volatility is 10%.
- Portfolio B:
- Includes both surviving stocks and those that failed or were delisted.
- The annual volatility is 15%.
Now, if we measure the volatility of both portfolios, Portfolio A is likely to show lower volatility since it excludes the more volatile and riskier stocks that failed. In contrast, Portfolio B, which includes all stocks, is likely to show higher volatility.
Hence, Portfolio B will provide a more accurate representation of market risks. The above difference in volatility highlights the additional risk that is not accounted for when failed entities are excluded. This makes traders unprepared for market downturns or unexpected losses.
Now, let’s check out an example involving “backtesting”:
| Parameters | Data | Result |
| Backtest with Biased Data | Only surviving stocks |
|
| Backtest with Complete Data | Includes both surviving and failed stocks |
|
It is clear from the above table that the biased data shows a much higher return and risk-adjusted performance (Sharpe ratio). This data misleads traders into overestimating the strategy’s effectiveness.
Identifying Survivorship Bias in Market Data
Survivorship bias can subtly infiltrate datasets. Such manipulation leads to skewed analysis and decisions. Hence, traders must spot them and take preventive measures. Let’s explore some common signs that indicate the presence of survivorship bias:
- Absence of Delisted or Bankrupt Companies:
- If historical stock data does not include companies that have been delisted or gone bankrupt, it may be a sign of survivorship bias.
- For example,
- Analyzing the S&P 500 and only including companies currently listed may ignore those removed due to poor performance.
- This will present an overly optimistic view of market returns.
- Consistently High-Performance Metrics:
- If a dataset or performance analysis consistently shows unusually high returns or low volatility, it could be because failed entities have been excluded.
- This will give an inflated view of success.
- Limited Historical Data:
- If the dataset only includes recent data or companies with a long history of success, it may omit entities that failed early.
- This again leads to biased conclusions.
- Inconsistent Sample Sizes:
- If the number of entities in the dataset changes significantly over time without a clear explanation, it might indicate the exclusion of failed entities.
- Selective Reporting:
- If reports or analyses only highlight successful periods or entities while ignoring periods of poor performance or failures, this selective reporting signals survivorship bias.
Now, let’s understand better through an example related to S&P 500 Analysis:
A common example of survivorship bias is analyzing the S&P 500 by only considering companies currently listed on the index. Be aware that the S&P 500 is a dynamic index where companies are regularly added and removed. Now, if historical analysis excludes companies due to poor performance, the resulting performance metrics will be higher than reality.
For example, an analysis showing the average annual return of the S&P 500 over 50 years might overestimate returns if it:
- Only includes companies still listed today,
and
- Ignores those who failed or were delisted.
Case Studies of Survivorship Bias Impact
For more clarity, let’s study the case study related to mutual fund performance in the late 1990s.
In the late 1990s, mutual funds often reported impressive returns. They did so by only including surviving funds in their performance data. This led investors to believe that mutual fund performance was consistently high. But, in reality, many funds had failed or closed due to poor performance.
When including all funds, both surviving and those that closed, the average performance was much lower. For example, a study might find that:
- The average annual return of surviving funds was 12%,
- but
- When failed funds were included the average return dropped to 6%.
As a result, investors were misled by the inflated performance metrics. They invested heavily, expecting high returns. This led to significant losses when their investments did not meet the overstated expectations.
In another case, hedge funds also experienced a similar issue, where only successful funds reported their performance. Failed funds, often closed and liquidated, were not included in performance metrics.
When a comprehensive analysis, including both surviving and failed funds, was performed, it revealed that the average hedge fund performance was significantly lower than reported. Consequently, investors faced:
- Unexpected risks
and
- Lower-than-expected returns
This led to financial losses and a re-evaluation of their investment strategies.
Mitigating Survivorship Bias
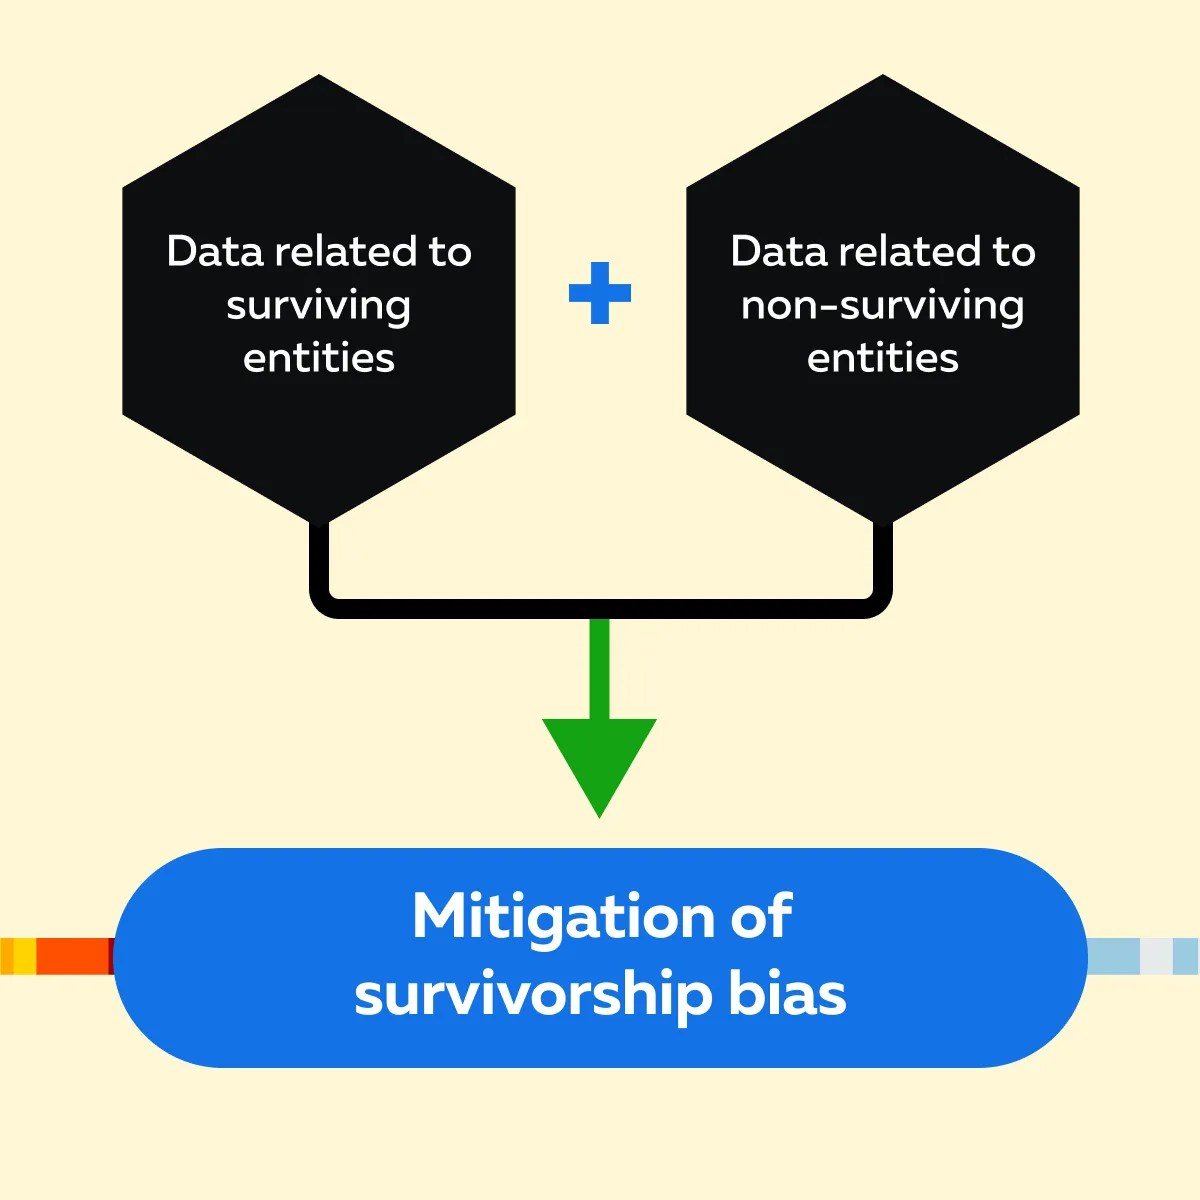
To effectively mitigate survivorship bias, it is crucial to use datasets that include both surviving and non-surviving entities. This comprehensive approach ensures that the analysis reflects the following:
- The true performance, and
- The risk associated with the market or trading strategy.

When it comes to comprehensive datasets, the CRSP (Center for Research in Security Prices) database is a valuable resource. It provides historical data on both listed and delisted stocks. Also, it offers a complete picture of the market by including companies that have:
- Gone bankrupt,
- Merged, or
- Been acquired.
Some other popular sources of such comprehensive datasets are financial databases like Bloomberg, Thomson Reuters, and FactSet. They also offer detailed historical data, including information on delisted and bankrupt stocks.
How to Adjust Backtesting Methods by Accounting for Survivorship Bias?
To account for survivorship bias in backtesting, it is essential to incorporate delisted stocks into the analysis. This approach provides a more accurate measure of a trading strategy’s performance. Here is how you can incorporate delisted stocks:
| Historical Inclusion | Data Adjustment |
|
|
For example,
- A backtest of a trading strategy from 2000 to 2020 should include all stocks that were listed during this period.
- If a stock was listed from 2000 to 2005 and then delisted, its performance from 2000 to 2005 should be included in the backtest, rather than ignoring it completely.
What are some Popular Statistical Techniques to Mitigate Survivorship Bias?
Several statistical techniques can mitigate the effects of survivorship bias, such as those delineated in the table below:
| Techniques | Bootstrapping | Monte Carlo Simulations |
| Meaning |
|
|
| Example |
|
|
Some Practical Recommendations
- Use databases like CRSP. This usage will ensure that your dataset includes all relevant stocks, including those that were delisted or went bankrupt.
- Include the performance of all stocks up to their delisting date in your backtests. This approach helps prevent overestimating returns and underestimating risks.
- Implement bootstrapping and Monte Carlo simulations to account for the randomness and variability of survival. This technique provides a more precise assessment of performance metrics.
Practical Applications and Strategies
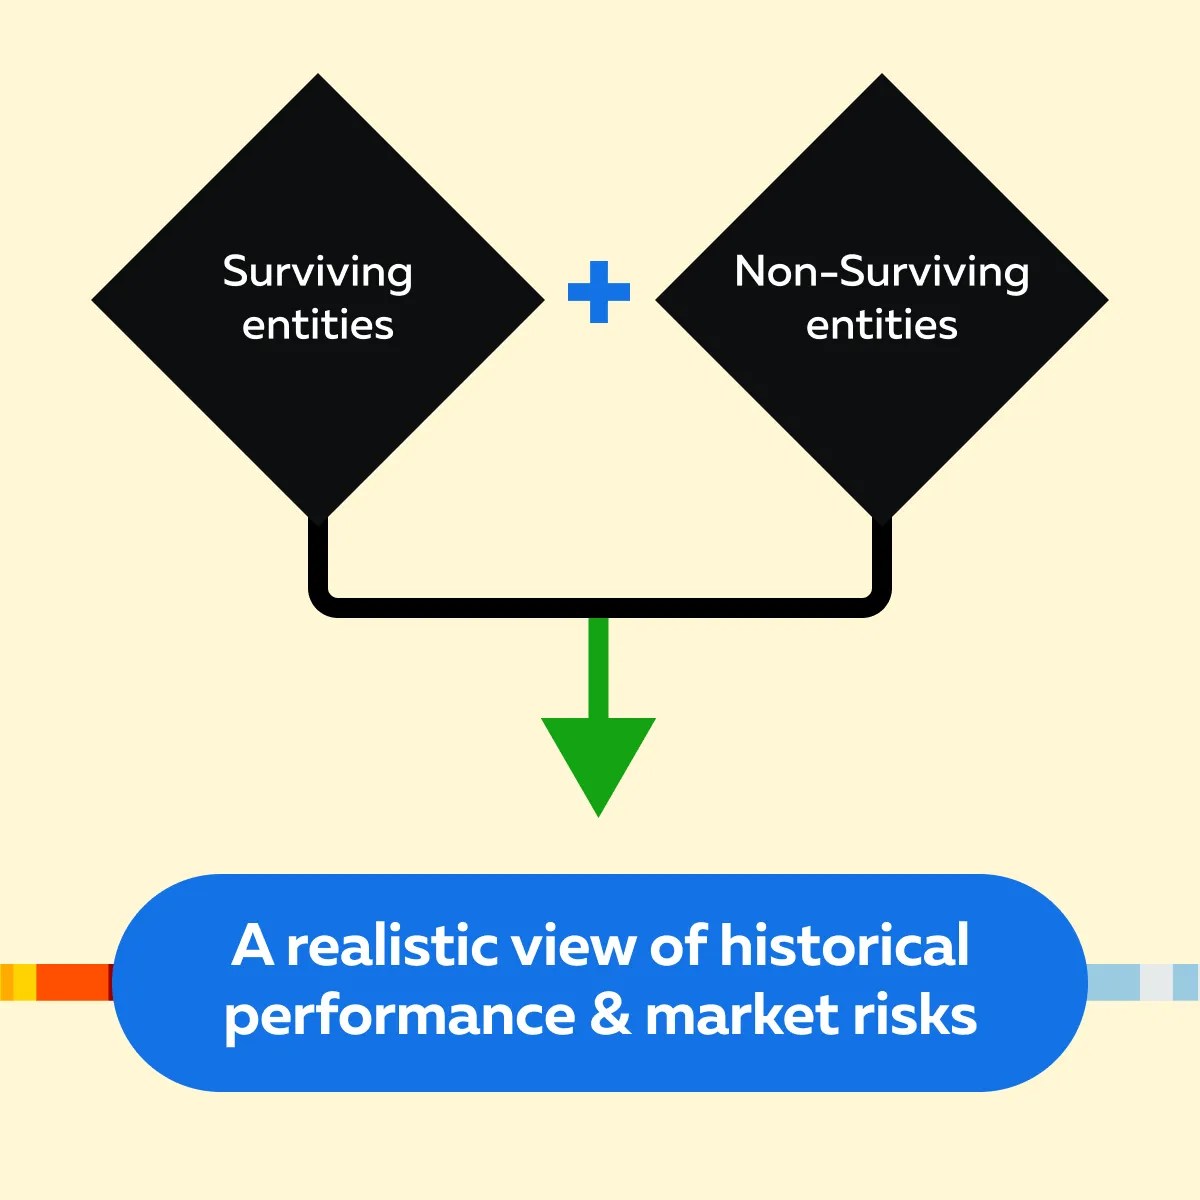
It is worth mentioning that by understanding and mitigating survivorship bias, traders can significantly enhance the accuracy of market analysis. See the graphic below to understand how incorporating both surviving and non-surviving entities into the analysis helps traders:

For Example:
- Say a trader notices that their backtested strategy shows consistently high returns.
- On closer inspection, they realized the dataset only includes currently listed companies.
- After adjusting their data to include delisted stocks, the trader finds that:
- The historical returns are actually lower
and
- There is a need for a more accurate and risk-aware strategy.
- Consequently, the trader revises their strategy.
- Now, they include more rigorous risk management techniques, such as stop-loss orders and diversification.
What are Some Tips for Developing Robust Trading Strategies?
Use comprehensive data, which includes stocks that were delisted due to bankruptcy or poor performance. This helps in creating a more accurate backtest and analysis. Furthermore, applying the following trading strategies is also advisable.
- Utilize databases like CRSP, Bloomberg, and FactSet. These databases provide extensive historical data, including delisted and bankrupt stocks.
- Diversify your portfolio across various asset classes, such as:
- Stocks,
- Bonds,
- Commodities, and
- Real estate.
- Invest in markets across different regions and countries to mitigate regional risks and benefit from global growth opportunities.
- Regularly update your dataset to include recent delistings and new listings. This ensures that your analysis remains current and reflects the latest market conditions.
- Verify the accuracy and completeness of your data sources to prevent inadvertent biases.
- Use stop-loss orders to limit potential losses in case of unfavorable market movements.
- Employ position sizing techniques to control the amount of capital allocated to each trade based on the risk level.
For Example:
A trader develops a strategy to trade technology stocks. Initially, the strategy looks promising based on backtests with currently listed tech companies. To ensure robustness, the trader includes delisted tech stocks in the backtest.
This reveals that many tech companies had failed in previous market downturns, which was not reflected in the initial backtest. The trader then diversifies their strategy by they including stocks from other sectors, such as healthcare and consumer goods. Additionally, they incorporate risk management tools like stop-loss orders. This diversified approach results in a more balanced portfolio with a realistic risk-return profile.
Conclusion
Survivorship bias is a logical error that can significantly skew market data analysis. It often leads to overestimated performance and underestimated risk. By only focusing on surviving entities and ignoring those that failed, traders usually develop an unrealistic view of their strategies.
To mitigate this, it’s crucial to use comprehensive datasets that include both surviving and non-surviving entities. Adjusting backtesting methods to incorporate delisted stocks and employing statistical techniques like bootstrapping and Monte Carlo simulations can provide a more accurate picture of potential returns and risks.
Furthermore, traders should critically assess their data sources and analytical methods to ensure they are not falling prey to survivorship bias. This will lead to more realistic and reliable trading strategies.
For more insights on effectively backtesting a trading strategy, click here.